
Sentinal Core Labs
Independent AI infrastructure operator. Proof, not promises.
We publish full performance evidence—logs, traces, and CSVs—so you can see exactly what our systems do.
- Run-critical GPU capacity with transparent performance envelopes.
- Latency and throughput tuned for enterprise inference workloads.
- Evidence-backed procurement with audit-ready artefacts.
Benchmark Overview (8×B200)
- Cluster
- 8×B200
- Benchmark window
- seq_len 512 (256 prompt + 256 generated)
- Iters/run
- 10
- Peak throughput
- ~163,840 tokens/sec (C++, batch 32)
- Latency (overall)
- p50 17.76–29.73 ms, p95 25.23–40.36 ms
- By mode (latency ranges)
- C++ p50 17.76–28.55 ms, p95 25.23–41.74 ms Python p50 22.45–27.09 ms, p95 32.76–40.21 ms
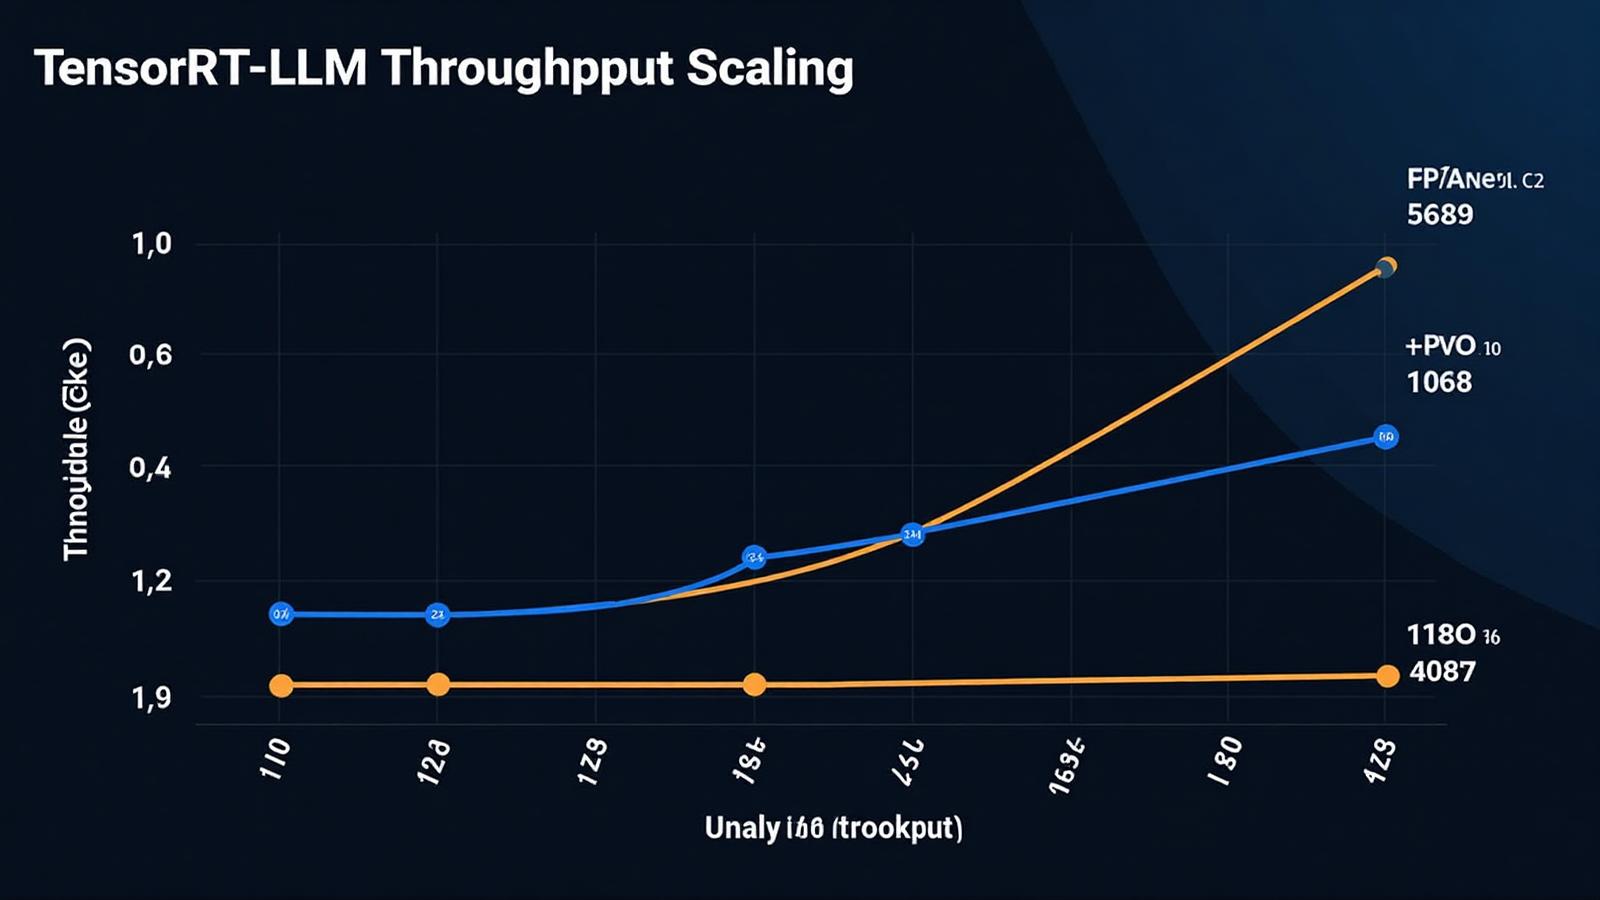
Scaling Plot
Validated growth from batch 1 to 32 with mirrored driver settings.
Detailed Results
| Mode | Batch | Throughput (tok/s) | p50 (ms) | p95 (ms) | SM Util (%) | Mem Util (%) |
|---|---|---|---|---|---|---|
| C++ | 1 | 5120.00 | 20.45 | 27.89 | 142.0 | 32.1 |
| Python | 1 | 3689.32 | 20.34 | 27.96 | 142.0 | 31.8 |
| C++ | 4 | 20480.00 | 18.55 | 25.96 | 142.0 | 32.1 |
| Python | 4 | 16657.42 | 18.25 | 30.74 | 142.0 | 31.8 |
| C++ | 8 | 40960.00 | 29.73 | 40.36 | 142.9 | 32.3 |
| Python | 8 | 33822.11 | 21.75 | 33.30 | 143.1 | 32.3 |
| C++ | 16 | 81920.00 | 23.93 | 32.84 | 142.7 | 32.3 |
| Python | 16 | 67548.17 | 27.71 | 35.24 | 143.4 | 32.0 |
| C++ | 32 | 163840.00 | 17.76 | 25.23 | 123.3 | 27.7 |
| Python | 32 | 118907.42 | 27.04 | 34.97 | 143.0 | 32.0 |
Enterprise Assurance
Procurement teams, SREs, and AI platform owners get the same evidence set we use internally—no summarized slides, just raw instrumentation you can replay.
- Driver parity: identical prompts, batch steps, and token windows across C++ and Python for apples-to-apples review.
- GPU residency: telemetry captures SM utilization down to fractional points to prove headroom.
- Reconstruction ready: logs, JSON perf dumps, Nsight traces, and CSV exports ship in the benchmark pack.
Methodology & Notes
- Tokenizer: model-native tokens (SentencePiece/BPE as used by the model family).
- Drivers: both C++ and Python measured.
- Batches: 1, 4, 8, 16, 32; 10 iterations each.
- Metrics recorded: throughput (tok/s), p50 & p95 latency (ms), average SM & memory utilization.
- Consistency: results corroborated by perf JSON dumps and Nsight traces.
- Interpretation: C++ consistently 30–40% faster at high batch sizes; overall p95 remains within 25–40 ms—production-class territory.
Benchmark Pack
We publish raw evidence—if you want to validate or reproduce, everything is inside the pack.
Download Full Benchmark Pack (zip)Logs
- logs/dmon_cpp_b1.log
- logs/dmon_cpp_b4.log
- logs/dmon_cpp_b8.log
- logs/dmon_cpp_b16.log
- logs/dmon_cpp_b32.log
- logs/dmon_py_b1.log
- logs/dmon_py_b4.log
- logs/dmon_py_b8.log
- logs/dmon_py_b16.log
- logs/dmon_py_b32.log
Performance dumps
- perf_dumps/perf_cpp_b1.json
- perf_dumps/perf_cpp_b4.json
- perf_dumps/perf_cpp_b8.json
- perf_dumps/perf_cpp_b16.json
- perf_dumps/perf_cpp_b32.json
- perf_dumps/perf_py_b1.json
- perf_dumps/perf_py_b4.json
- perf_dumps/perf_py_b8.json
- perf_dumps/perf_py_b16.json
- perf_dumps/perf_py_b32.json
Summaries
- perf_dumps/summary_1759302230.json
- perf_dumps/summary_1759302400.json
- perf_dumps/summary_1759302603.json
- perf_dumps/summary_1759302690.json
- perf_dumps/summary_1759302786.json
- perf_dumps/summary_1759302882.json
- perf_dumps/summary_1759303027.json
Nsight traces
- nsys_reports.tar.gz
- nsys_reports.b64
Plot files
- assets/trtllm_tokens_vs_batch.png
- plot.b64
CSV results
- trtllm_results.csv
Contact
Questions or integration? ops@sentinalcorelabs.com